
Relevance. Currently, the problem of protecting the economic interests of enterprises is very important, but it is not given enough attention by the heads of organizations. Protecting the interests of the enterprise is the goal of ensuring the security of the enterprise.
Economic security plays the main role in the enterprise security system. Economic security is the protection of its scientific, technical, technological, production and personnel potential from direct (active) or indirect (passive) economic threats, for example, related to ineffective scientific and industrial policy of the state or the formation of an unfavorable external environment, and the ability to reproduce it [1].
The main goal of economic security is to ensure long-term and most effective functioning of the enterprise today and high development potential in the future.
Each manager must assess the level of economic security of his company. This indicator allows you to evaluate the efficiency of using resources for the functional components of the organization’s economic security. The level of economic security of an organization depends on how competently and rationally its managers (management) are able to prevent the emergence of threats and potential risks and, accordingly, prevent them with minimal losses.
To assess the level of economic security of an enterprise, a comprehensive indicator of the level of functional components of the organization’s economic security is used. Modern conditions require the creation of a comprehensive system of economic security in each institution. An integrated system for ensuring the economic security of an enterprise is a set of interconnected legal, organizational and engineering measures aimed at protecting it from real and potential threats. Any enterprise is a system that includes certain elements and connections between them. When implementing internal and external connections of the system, threats to its economic security may be realized [2].
The proposed system of components includes a corresponding number of indicators for determining the level of each component. (table 1)
Table 1
System of indicators for assessing the level of economic security components
| Functional components | Indicators
|
| Financial component | -Indicators of solvency, liquidity of the enterprise, net working capital; -Indicators of financial stability; -Indicators of profitability; -Indicators of market activity and position on the securities market |
| Production and technological component | -Ratio of profit and disposal of fixed assets; -Production structure; -Asset return and asset intensity |
| Regulatory and legal component | -Ownership, disposal or use of intangible assets, for example: a patent for an image, industrial design, utility model; -Right to a trademark; -Right to a company name |
| Information component | -Speed of response of the organization to changes in factors of the external and internal environment |
The result of ensuring the economic security of an enterprise is the stability of its functioning and the profitability of financial and economic activities. The main directions of ensuring the economic security of a business entity follow from the functional elements of the economic security of an enterprise [3].
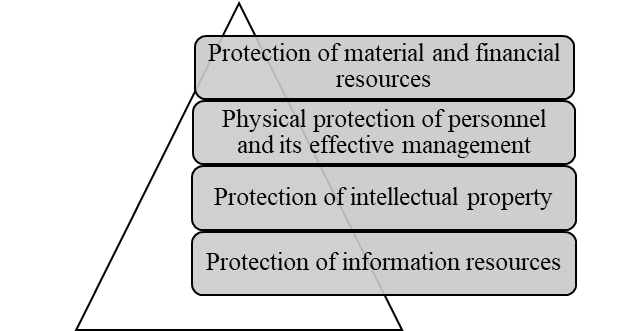
Figure 1 — Main directions of ensuring economic security of a business entity
Various threats also affect the efficient operation of the enterprise: proper selection of personnel (creative approach, creation of a psychological sphere), lack of a marketing strategy, threat among real competitors in the market (the ability of other organizations to reduce prices in the market), market power of suppliers (material suppliers can increase prices and/or reduce the quality of the offered goods, which will lead to an increase in production costs, and therefore to a decrease in profitability), the threat of the emergence of substitute goods, intra-industry competition (more often leads to an increase in the costs of product promotion, to price competition, an increase in investments in new developments). All these risks and threats lead to a decrease in the economic efficiency and economic security of the enterprise.
Let us evaluate the economic efficiency and security of the enterprise using the example of Zemlyanskmoloko LLC. The main activity is the production of milk (except raw) and dairy products. Table 2 presents the main economic indicators of Zemlyanskmoloko LLC.
Table 2
Economic performance indicators of Zemlyanskmoloko LLC
| Indicators | Years | Changes in the value of the indicator | |||||
| Absolute | Relative | ||||||
| thousand rubles | % | ||||||
| 2022 | 2023 | 2024 | 2023 from 2022 | 2023 from 2024 | 2023 by 2022 | 2023 by 2024 | |
| Revenue, thousand rubles | 5 496 926 | 4 907 922 | 5 935 268 | -589 004 | 1 027 346 | 89,28 | 120,93 |
| Cost price, thousand rubles | 4 344 447 | 3 786 024 | 4 502 441 | -558 423 | 716 417 | 87,15 | 118,92 |
| Gross profit, thousand rubles | 1 152 479 | 1 121 898 | 1 432 827 | -30 581 | 310 929 | 97,35 | 127,71 |
| Sales profit, thousand rubles | 531 320 | 450 447 | 690 024 | -80 873 | 239 577 | 84,78 | 153,19 |
| Other income, thousand rubles | 69 742 | 30 424 | 40 054 | -39 318 | 9 630 | 43,62 | 131,65 |
| Other expenses, thousand rubles | 47 022 | 6 701 | 23 843 | -40 321 | 17 142 | 14,25 | 355,81 |
| Profit before tax, thousand rubles | 539 515 | 494 407 | 758 041 | -45 108 | 263 634 | 91,64 | 153,32 |
| Current income tax, thousand rubles | 110 830 | 101 523 | 146 489 | -9 307 | 44 966 | 91,60 | 144,29 |
| Net profit (loss) | 428 671 | 392 883 | 611 157 | -35 788 | 218 274 | 91,65 | 155,56 |
As a result of the analysis of the financial results of Zemlyanskmoloko LLC, it can be concluded that in 2023 there is a decrease in revenue by 10.72%, but in 2024 there is a significant increase in revenue by 20.93%, which indicates stabilization and possible improvement in the company’s market position. In 2023, the cost price decreases by 12.85%, and in 2024 the cost price increases by 18.92%, which is probably due to an increase in production volumes or an increase in the cost of materials. In 2023, gross profit decreases by 2.65%, reflecting possible problems with production efficiency or changes in cost structure. In 2024, gross profit increases by 27.71%, which is a positive indicator and indicates an increase in profitability. In 2023, sales profit decreases by 15.22%, but in 2024, sales profit increases by 53.19%, which shows improved operating efficiency and revenue management. In 2023, other income decreases by 56.38%, which may indicate a decrease in non-operating income, in 2024, other income increases by 31.65%, which slightly improves the overall financial result. Other expenses increase by 255.81% in 2024, which has a negative impact on net profit. In 2023, profit before tax decreases by 8.36%, but in 2024, profit before tax increases by 53.32%, demonstrating successful overcoming of the crisis and adaptation to market changes. In 2023, net profit decreases by 8.34%, indicating serious challenges for the company. In 2024, net profit increases by 55.56%, indicating a significant improvement in the financial condition.
To assess the financial condition and operating efficiency of Zemlyanskmoloko LLC, we will analyze the indicators using the methods used in Table 2. Namely: balance sheet liquidity analysis, relative financial stability indicators analysis, and operating profitability analysis.
Table 3
Liquidity indicators of Zemlyanskmoloko LLC
| Indicators | Standard | 2022 | 2023 | Change (+;-) | 2024 | Change (+;-) |
| Absolute liquidity ratio | 0.2 and more | 1,75 | 1,80 | 0,05 | 2,06 | 0,26 |
| Current liquidity ratio (total coverage ratio) | 2 and more | 1,83 | 2,38 | 0,55 | 2,92 | 0,54 |
| Critical assessment ratio (urgent liquidity) | 1 and more | 0,55 | 0,59 | 0,04 | 0,86 | 0,27 |
An analysis of liquidity indicators for the period from 2022 to 2024 shows positive dynamics for all the considered ratios. The absolute liquidity ratio increased from 1.75 in 2022 to 2.06 in 2024, which exceeds the established minimum value of 0.2. This indicates a significant increase in the share of highly liquid assets, such as cash and cash equivalents, which allows the company to cover its short-term liabilities faster. The current liquidity ratio increased from 1.83 in 2022 to 2.92 in 2024, which significantly exceeds the minimum threshold of 2. This suggests that the company’s current assets significantly exceed its current liabilities, which increases its ability to cope with short-term debt. The critical assessment ratio increased from 0.55 in 2022 to 0.86 in 2024, but is still below the recommended value of 1.
However, this positive trend indicates an increase in the share of the most liquid assets relative to short-term liabilities, which improves the company’s overall liquidity.
Thus, an improvement in all three liquidity indicators demonstrates successful management of the company’s assets and liabilities, which leads to an increase in its financial stability and solvency. Increased liquidity levels allow the company to better cope with unexpected expenses and provide greater flexibility in making financial decisions.
Table 4
Relative indicators of financial stability of Zemlyanskmoloko LLC
| Indicators | Standard | 2022 | 2023 | Change (+;-) | 2024 | Change (+;-) |
| Ratio of own working capital | 0.1 and more | 0,50 | 0,55 | 0,50 | 0,66 | 0,11 |
| Ratio of financial independence (autonomy) | 0.65-0.8 | 0,50 | 0,59 | 0,54 | 0,59 | 0,00 |
| Ratio of financial leverage | 0.82 and less | 0,99 | 0,70 | -0,29 | 0,69 | -0,01 |
| Ratio of investment coverage | Not less than 0.85 | 0,58 | 0,71 | 0,13 | 0,74 | 0,03 |
| Ratio of own working capital maneuverability | Not less than 0.05 | 0,53 | 0,49 | -0,04 | 0,59 | 0,10 |
| Ratio of reserves | 0.5 and more | 0,50 | 0,55 | 0,05 | 0,66 | 0,11 |
The analysis of the company’s financial stability indicators for the period from 2022 to 2024 shows positive dynamics. The ratio of own working capital increased from 0.50 to 0.66, which indicates an increase in the company’s ability to finance its activities from internal sources. The financial independence (autonomy) ratio remained stable at 0.59, which indicates a balanced ratio of equity and debt capital, which reduces the risks of dependence on external sources of financing. The financial leverage ratio decreased from 0.99 to 0.69, indicating a decrease in dependence on borrowed capital. The investment coverage ratio increased from 0.58 to 0.74, reflecting an improvement in the company’s ability to cover its investment obligations. The maneuverability ratio of own working capital also improved, increasing from 0.53 to 0.59, which indicates increased flexibility in asset management. The inventory coverage ratio increased from 0.50 to 0.66, demonstrating an increase in the stock of equity funds for inventory financing.
Overall, the company’s financial position is strengthening, which is a positive signal for investors and creditors.
Table 5
Profitability indicators of the activities of Zemlyanskmoloko LLC
| Indicator | Period | Deviation (±∆) | |||
| 2022 | 2023 | 2024 | 2023 to 2022 | 2024 to 2023 | |
| Return on assets | 34,06 | 25,22 | 37,58 | -8,84 | 12,36 |
| Return on expenses | 26,53 | 29,63 | 31,82 | 3,10 | 2,19 |
| Return on sales | 9,67 | 9,18 | 11,63 | -0,49 | 2,45 |
| Return on equity | 43,41 | 41,44 | 49,97 | -1,97 | 8,53 |
As a result of the analysis of the profitability indicators of the activities in the period from 2022 to 2024, it can be concluded that a significant decline in return on assets in 2023 (to 25.22%) indicates possible problems in resource management, but in 2024 the indicator sharply increased to 37.58, which indicates high efficiency of asset use. A gradual increase in return on costs from 26.53% in 2022 to 31.82% in 2024 indicates a continuous improvement in cost control. A sharp increase in return on sales in 2024 (to 11.63%) confirms successful management of operating activities, but a decrease to 9.18% in 2023 may signal increased competition or an increase in costs. The high level of return on equity in 2024 (49.97%) emphasizes the attractiveness of investments for shareholders, but a decrease to 41.44% in 2023 requires analysis to identify possible risk factors.
Based on the above analysis, it is necessary to develop directions for eliminating the identified deficiencies and improving the financial condition of the organization.
The economic efficiency and safety of the enterprise OOO Zemlyanskmoloko are also affected by the previously mentioned threats, the correct selection of personnel: a creative approach, the creation of a psychological sphere, the lack of a marketing strategy, a threat among real competitors in the market, the market power of suppliers who undermine the level of security of the enterprise.
To improve the performance of Zemlyanskmoloko LLC, the following measures can be proposed:
— capital structure management (reduce the amount of borrowings to reduce financial leverage and increase financial stability, consider increasing the authorized capital or issuing additional shares to increase the share of equity);
— optimization of asset and liability management (ensure adequate coverage of inventories with equity capital to minimize the risk of inventory shortages, increase highly liquid assets to ensure the ability to fulfill short-term obligations on time, improve the management of current assets and liabilities to increase overall solvency);
— cost control and profitability improvement (constantly analyze and control expenses to achieve maximum cost effectiveness, implement new technologies and processes to improve productivity and reduce costs, develop a marketing and pricing strategy to maintain competitiveness and grow revenues);
— attracting and retaining customers (activate marketing campaigns to attract new customers and retain existing ones, offer customers new products and services that can meet their needs and stimulate demand).
These proposals will help strengthen the financial position of Zemlyanskmoloko LLC, improve liquidity, profitability and stability indicators, and ensure long-term growth and prosperity of the company.
Conclusion. Thus, the mechanism for ensuring economic efficiency and security is based on the systematic unification of tools, methods, means and information and analytical support created on the basis of the formulated principles of ensuring economic security, as well as those that are formulated by the subjects of economic security management of the enterprise to achieve and protect its financial interests. The above measures will increase the level of economic security of the organization and prevent threats in the future.
Библиографический список
1. Economic Security of Russia. General Course: textbook / edited by V. K. Senchagov. — 6th ed. - Moscow: Knowledge Laboratory, 2020. - 818 p. - ISBN 978-5-00101-840-7. - Text: electronic. - URL: https://znanium.ru/catalog/product/1209184 (accessed: 19.03.2025). – Access mode: by subscription.2. Tsybulin A. M., Zapryagaylo V. M., Kulagina I. I. Ensuring a comprehensive audit of business security: a teaching aid / A. M. Tsybulin, V. M. Zapryagaylo, I. I. Kulagina; Volgograd Institute of Management - branch of the Federal State Budgetary Educational Institution of Higher Education RANEPA. – Volgograd: Publishing House of the Volgograd Institute of Management – branch of RANEPA, 2017.
3. Sergeeva I.A., Sergeev A.Yu. Integrated system of ensuring economic security of the enterprise: textbook / I.A. Sergeeva, A.Yu. Sergeev – Penza: Publishing house of PSU, 2017 – 124 p. - ISBN 978-5-906913-52-4